


As we showed in “How does an LLM work?”, a response takes shape one token at a time. We can picture the choice of the next piece of text as a weighted dice roll. Likely continuations receive more dice numbers than unlikely ones. The temperature setting changes this weighting. It determines how strongly the favourites are favoured when we roll. [1]
As in article 01, we simplify the example by treating whole words as tokens. Real tokens can also be parts of words or punctuation. Our twenty-sided die, or W20, represents random selection from calculated probabilities. There is no physical die inside the computer.
Temperature changes the weighting
We start again with “My cat has”. In our invented example, “arrived” is the most likely continuation. A low temperature gives this favourite a stronger advantage. It receives a larger range of numbers on our W20, while less likely continuations receive smaller ranges.
At a higher temperature, the differences become smaller. Weaker candidates get more chances, but the favourite remains the favourite. Temperature does not reverse the ranking. A less likely word is not automatically better or particularly creative. [1]
The image compares temperatures of 0.5, 1 and 2. At 1, the original weighting is unchanged. That does not mean 1 is the default in every application. We use the same roll of 9 in all three columns to make the changed ranges visible. [2]
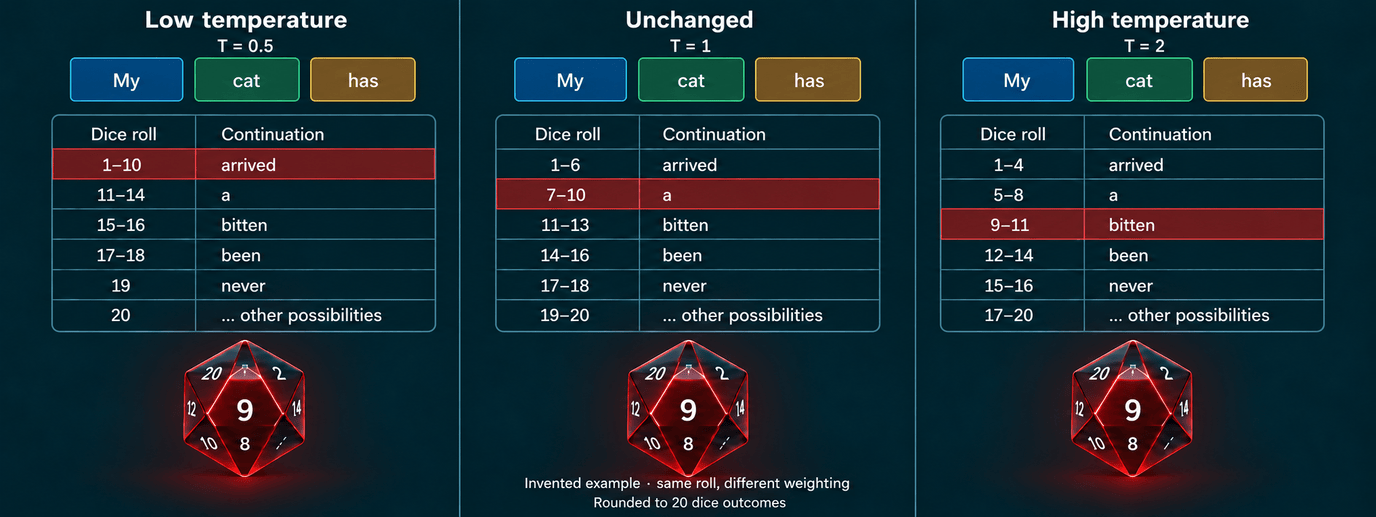
Image content as text
All three columns start with “My cat has”. The continuations, in the same order, are “arrived”, “a”, “bitten”, “been”, “never” and other possibilities.
- Temperature 0.5. The ranges are 1 to 10, 11 to 14, 15 to 16, 17 to 18, 19 and 20. The roll of 9 selects “arrived”.
- Temperature 1. The ranges are 1 to 6, 7 to 10, 11 to 13, 14 to 16, 17 to 18 and 19 to 20. The roll of 9 selects “a”.
- Temperature 2. The ranges are 1 to 4, 5 to 8, 9 to 11, 12 to 14, 15 to 16 and 17 to 20. The roll of 9 selects “bitten”.
The original probabilities are invented: 30%, 20%, 15%, 15% and 10% for the five named words, plus 5% each for two other candidates. Temperature is applied to the individual candidates before the two others are grouped together. The ranges are rounded to 20 dice numbers. These are not measurements from a model.
Here, weighting the roll means changing the selection probabilities, not the model weights stored during training. Temperature is not a control for intelligence or truth. At temperature 0, many applications choose the most likely continuation instead of making a random selection. That does not guarantee identical complete responses in every environment. [2]
Top-p limits the selection
While temperature changes the weighting, top-p determines which continuations are considered at all. Candidates are ordered by probability. Starting with the favourite, enough are included for their combined probability to reach at least the chosen value. [3]
At top-p = 0.8, our example keeps “arrived” at 30%, “a” at 20%, and “bitten” and “been” at 15% each. Together they reach 80%. “Never” and the other possibilities are excluded for this step.
The remaining probabilities are rescaled to add up to 100%. They do not become equal. “Arrived” remains more likely than “a”. Top-p = 0.8 therefore does not mean keeping 80% of all tokens. Depending on the distribution, it may take a few candidates or many to reach the threshold. At top-p = 1, this restriction is disabled. [2] [3]
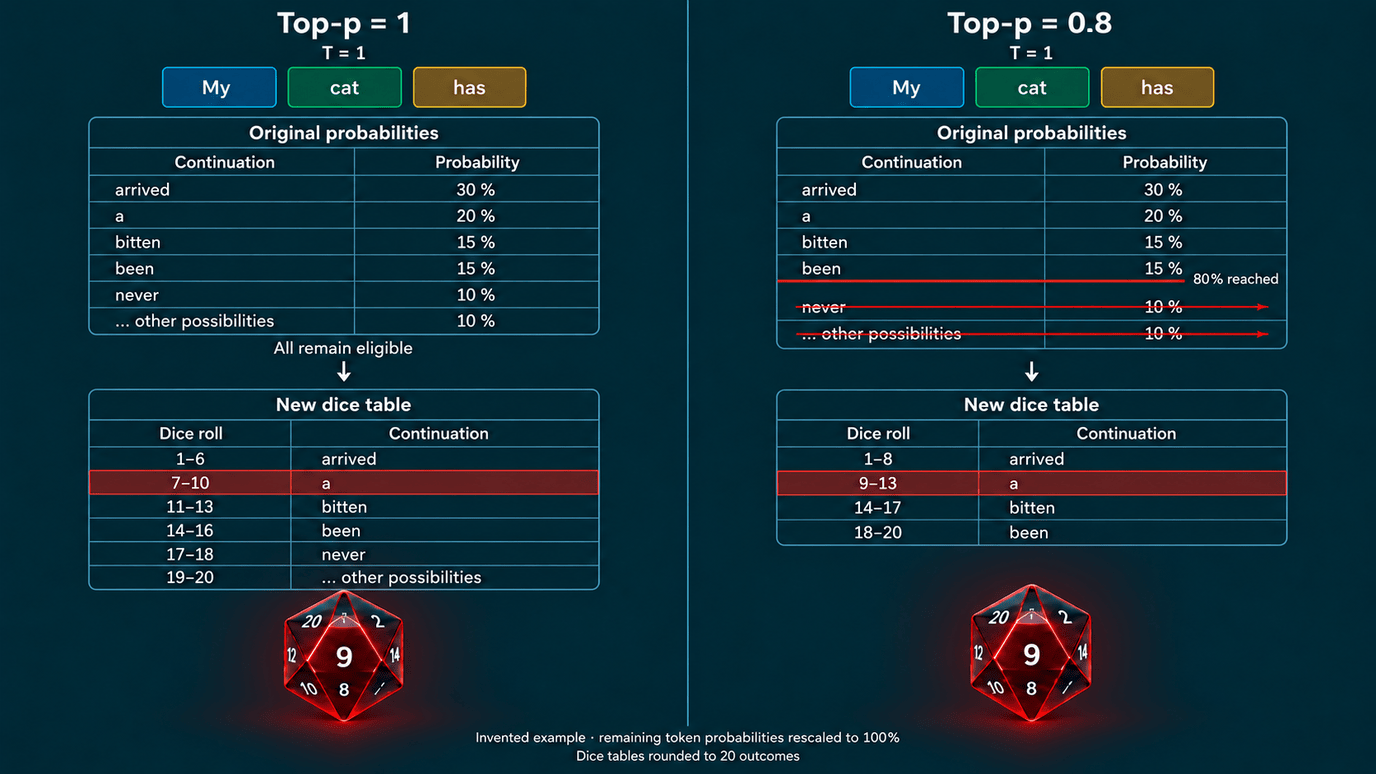
Image content as text
Both columns start with “My cat has” at temperature 1. The invented original probabilities are “arrived” 30%, “a” 20%, “bitten” 15%, “been” 15%, “never” 10% and other possibilities totalling 10%.
- Top-p 1 keeps all candidates. The ranges are 1 to 6 for “arrived”, 7 to 10 for “a”, 11 to 13 for “bitten”, 14 to 16 for “been”, 17 to 18 for “never” and 19 to 20 for other possibilities.
- Top-p 0.8 reaches 80% after “been”. “Never” and other possibilities are crossed out. After rescaling to 100%, the rounded ranges are 1 to 8 for “arrived”, 9 to 13 for “a”, 14 to 17 for “bitten” and 18 to 20 for “been”.
Both dice show 9 and select “a”. A changed filter does not have to produce a different result on a single roll. All examples are invented and rounded to 20 outcomes.
Top-k limits the number
Top-k determines how many of the most likely continuations remain eligible. At top-k = 2, our example keeps only “arrived” and “a”. Unlike top-p, top-k sets a fixed number rather than a probability threshold. [2]
The other continuations are excluded. The two favourites' probabilities are rescaled to add up to 100%, but remain different. On our W20, “arrived” now receives twelve numbers and “a” eight.
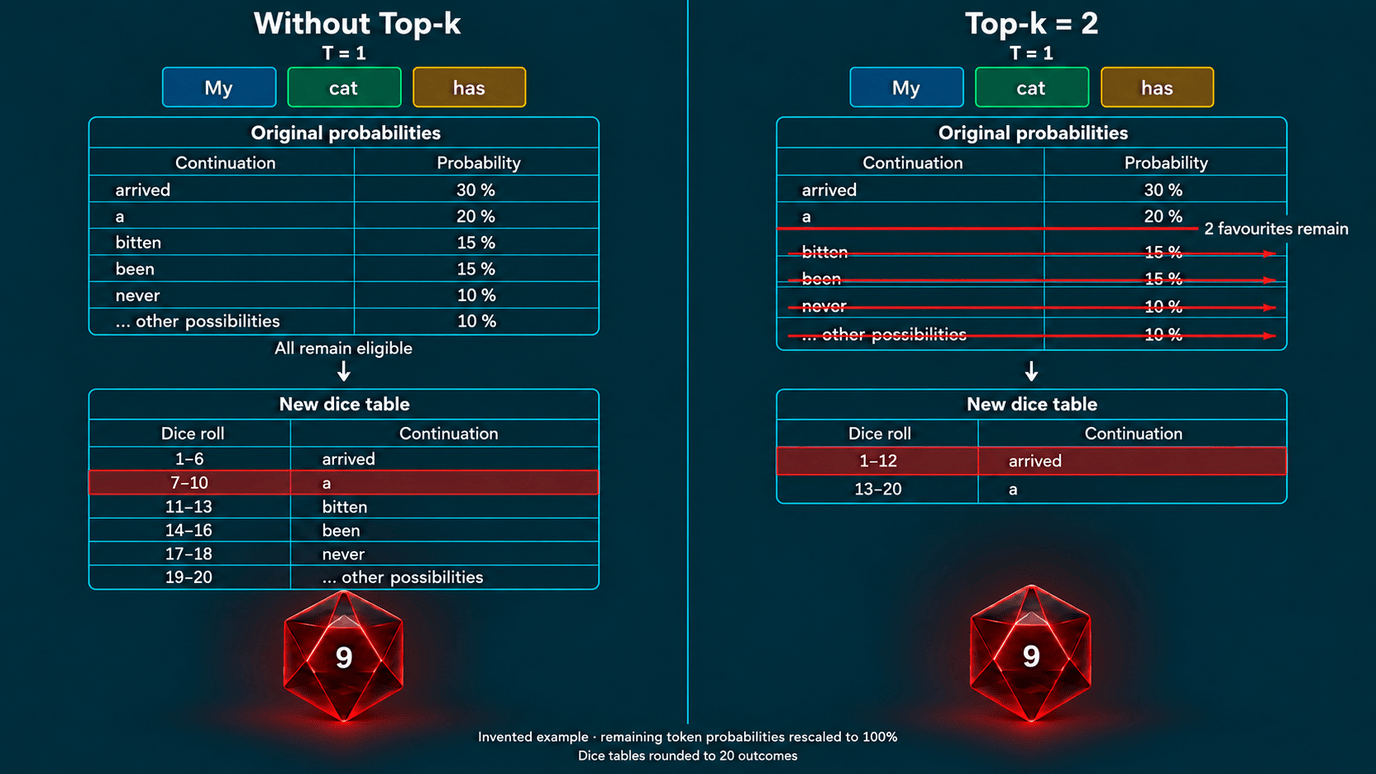
Image content as text
Both columns start with “My cat has” at temperature 1. The invented original probabilities are “arrived” 30%, “a” 20%, “bitten” 15%, “been” 15%, “never” 10% and other possibilities totalling 10%.
- Without top-k, all candidates remain. The ranges are 1 to 6 for “arrived”, 7 to 10 for “a”, 11 to 13 for “bitten”, 14 to 16 for “been”, 17 to 18 for “never” and 19 to 20 for other possibilities.
- Top-k 2 keeps only “arrived” and “a”. The other four rows are crossed out. The probabilities are rescaled from a combined 50% to 100%. “Arrived” receives 60% and numbers 1 to 12; “a” receives 40% and numbers 13 to 20.
Both dice show 9. Without the filter, “a” is selected; with top-k 2, “arrived” is selected. This is an invented example, not a model measurement.
Min-p compares with the favourite
Min-p sets how likely a continuation must be compared with the favourite. At min-p = 0.5, it must be at least half as likely. If “arrived” has a 30% chance, all continuations with at least a 15% chance remain eligible. [2]
Weaker candidates are excluded. The remaining probabilities are again rescaled to add up to 100%. Unlike top-k, min-p does not set a fixed number. Its threshold depends on the current favourite's probability at each step.
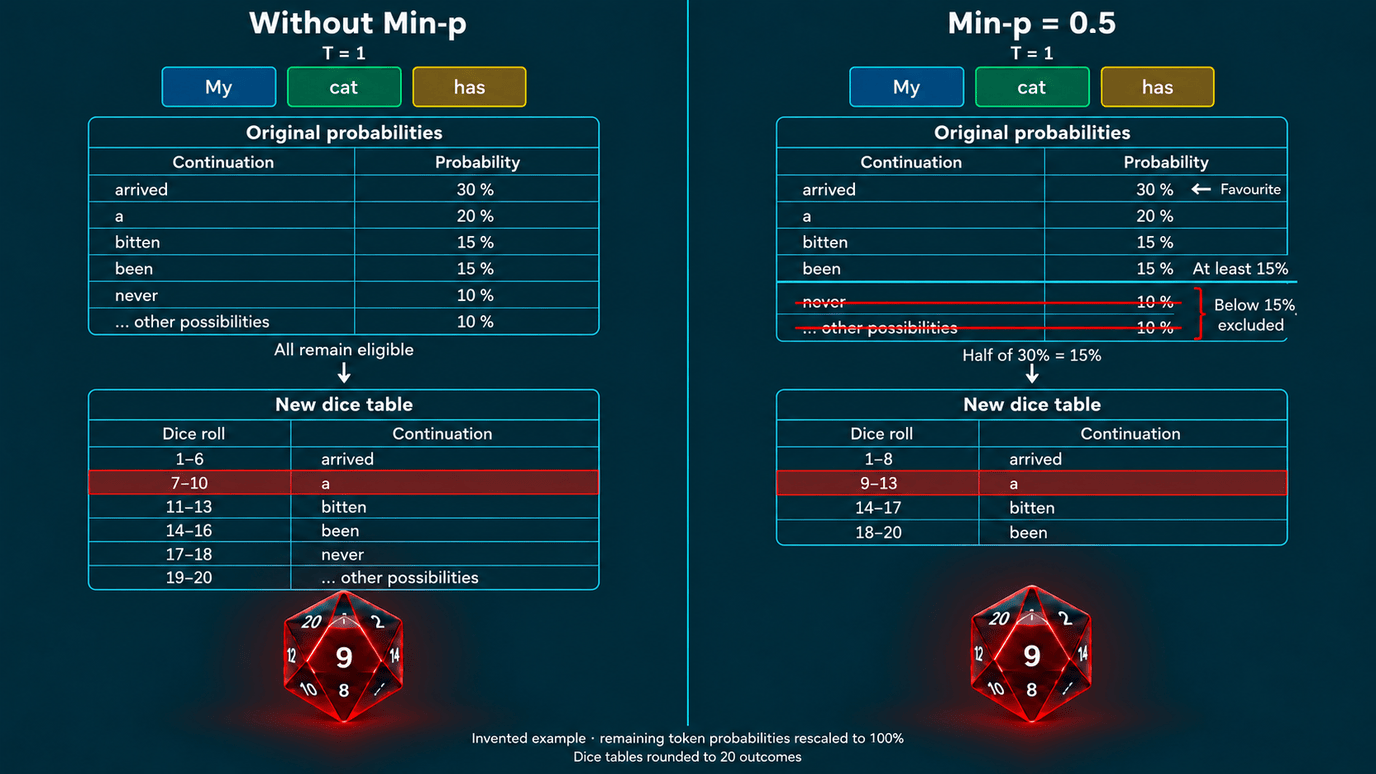
Image content as text
Both columns start with “My cat has” at temperature 1. The invented original probabilities are “arrived” 30%, “a” 20%, “bitten” 15%, “been” 15%, “never” 10% and other possibilities totalling 10%.
- Without min-p, all candidates remain. The ranges are 1 to 6 for “arrived”, 7 to 10 for “a”, 11 to 13 for “bitten”, 14 to 16 for “been”, 17 to 18 for “never” and 19 to 20 for other possibilities.
- At min-p 0.5, “arrived” at 30% is marked as the favourite. Half of that gives a minimum probability of 15%. “Arrived”, “a”, “bitten” and “been” remain. “Never” and other possibilities fall below the threshold and are crossed out.
- The remaining probabilities are rescaled to 100%. The rounded ranges are 1 to 8 for “arrived”, 9 to 13 for “a”, 14 to 17 for “bitten” and 18 to 20 for “been”.
Both dice show 9 and select “a”. Min-p and top-p happen to retain the same candidates in this example, but use different thresholds. All values are invented and rounded to 20 dice numbers.
Two settings, different jobs
Temperature changes how strongly the most likely continuations are favoured. Top-p limits which continuations take part in the selection at all. When both are used together, temperature first changes the weighting. Top-p then applies its threshold. [1] [3]
In our dice example, temperature changes the number ranges. Top-p then removes continuations outside its threshold and redistributes the dice numbers among the remaining possibilities. The same top-p value can therefore retain different numbers of candidates at different temperatures.
There are no universally best values. Which settings produce useful results depends on the model and the task. When experimenting, changing one setting at a time makes its effect easier to recognise. The available controls and the way multiple filters are combined depend on the software.
Deeper into the Rabbit Hole
Videos in English
- 3Blue1Brown — Transformers, the tech behind LLMs — a visual introduction to the foundations of token selection and temperature. The corresponding text adaptation was read for this article.
- Gary Explains — The Secret Controls for your LLM: Temperature, Top-K, Top-P, etc — around 15 minutes on temperature, top-p and other sampling controls. The video is sponsored by Genspark. Its title and description were checked, not the complete video.
Texts
- 3Blue1Brown — Transformers, the tech behind LLMs — the illustrated text adaptation explains how calculated scores become selection probabilities and how temperature changes them.
- Holtzman et al. — The Curious Case of Neural Text Degeneration — the original research paper on top-p, also called nucleus sampling. Section 3.1 explains the selection threshold using equations. Its results come from experiments with models of the time and do not guarantee the quality of today's LLMs.
Sources
- 3Blue1Brown — Transformers, the tech behind LLMs. Explanation by Grant Sanderson, text adaptation by Justin Sun. The sections on token selection, softmax and temperature were read.
- vLLM — SamplingParams. Parameter descriptions for temperature, top-p, top-k and min-p. This documentation describes that software, not every application.
- Holtzman et al. — The Curious Case of Neural Text Degeneration. ICLR 2020. The abstract and relevant excerpts from sections 3.1 and 3.2 were read, not the entire paper.